An alternative way to get the insight you need to create your strategy
This is an alternate method of making your diagnosis. The information here is from Christopher J Frank and Paul Magnone and their book, “Drinking from the Fire Hose,” which is about making smarter decisions without drowning in information.
The problem today is the amount of information that is available and continues to expand at an incomprehensible pace. I had a friend who, in 1948, was one of the very early computer programmers. At that time, it cost 1 million dollars to produce and store one megabit (MB) of information. Today, the estimates are that by 2020, we will be generating 1,7 MB of data every second for every person on earth. That’s a lot of data to go through looking for an answer.
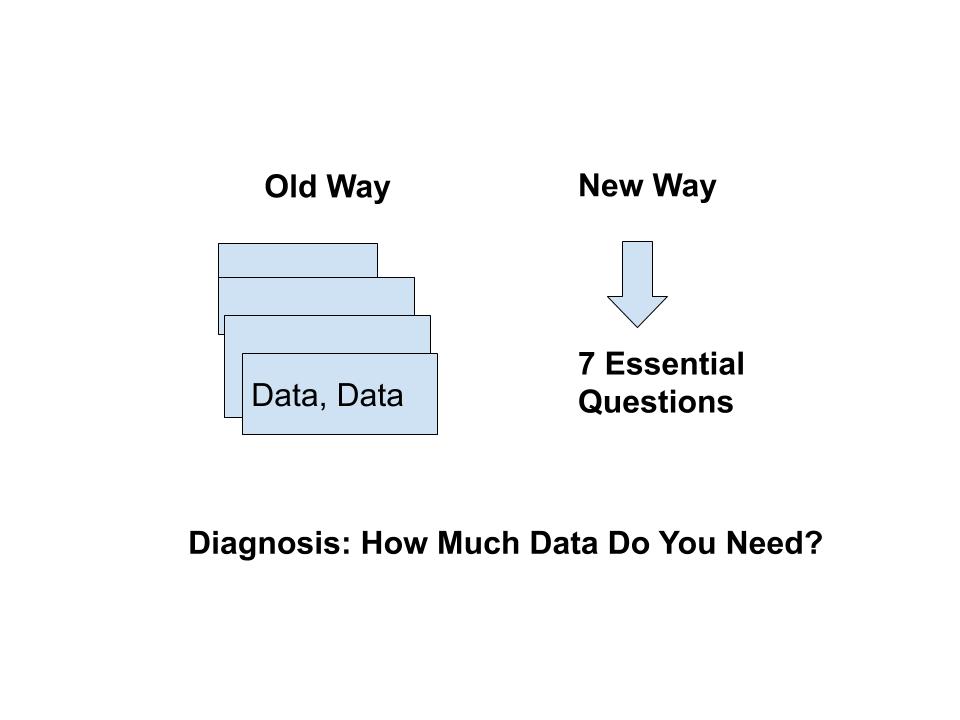
The good news is that most of that data is irrelevant. Frank and Magnone have created a way to use only seven questions to get the data you need to answer your question. That section is about another way to diagnosis a problem or opportunity to create a strategy that will set you apart from your competitors.
This method is one of several approaches you can use to diagnose the problem. You can use one or all of them. That goes for the seven questions, as well. You can use them all or use the ones you need to get your answer.
I encourage you to look at this method as one way to make your diagnosis. It offers many benefits, including:
This system of questioning helps you recognize the difference between data that measures and data that informs.
Using these questions will help optimize what you do and what you can do with the time you have.
These questions make it easier for you to zero in on the essential information you need to make timely, practical decisions and inspire others on your team to do the same.
- It shows you how to divide data into two fundamental groups: data that measures and data that informs.
- Data that measures tracks performance by assessing the impact or by tracking the market.
- Data that informs builds understanding, tests concepts, and strategies, and shapes decisions
We often spend way too much money and time on data that measures and not enough on data that informs. This method and these seven questions bring a big-picture perspective to the problem and make it possible to turn this information into useful insights.
Following is a summary of the seven questions. The seven items are divided into three parts: one, Discovery, two, Insight and three, Delivery.
Discovery. Here is where you gather information, but only focus on the information you’ll need.
That means limiting the amount of data you gather by using question
1. “What is the one, vital piece of information you need to move forward?” This is the Essential Question. If the information does not relate to or help you answer that question, you don’t need it.
2. The second question in discovery is, “What is your customer’s Northstar?’ Only gather data that w you to interpret and understand your customer’s needs, wants, and behavior in absolute and relative terms.
3. The third question is, “Should you believe in the squiggly line?’ In other words, how relevant are short-term movements to your long-term objectives? Learn to identify long-term trends that coincide with your long-term interests. Also, triangulate results using absolute position changes over time and comparative measures (e.g., year-over-year).
It takes time to shift your focus from amassing data to finding and interpreting only the data needed to answer the Essential Question and move your business forward. As you can see, this limits the volume of information you have to gather to only information you can use to solve the problem.
Insight. These questions lead you to fresh insights and allow you to see complex situations clearly.
4. Question four is, “What surprised you? Here you are looking for game-changing information, not confirmation bias. Game-changing information is always a surprise. Look at the numbers on the page, not the numbers you expected. Anomalies in the data are more likely to reveal opportunities than numbers that conform to expectations. Use your intuition and natural skepticism to look for surprises.
5. Question five is, “What does the lighthouse reveal?” As you navigate through the useful information, you need to know which numbers symbolize the rocks in your path. Define the criteria that are meaningful to your business. But because things are changing all the time, watch for information that could be damaging. For example, what kind of data, numbers, or information do you need to keep out of trouble?
6 Question six is, “Who are your swing voters?” Most companies focus on their delighted customers or critical customers who will never become customers. But, categorizing, segmenting and targeting your swing voters is the most effective way to drive growth at the lowest cost. Segment your neutral customers into learners, neutrals, or defectors. Profile each segment so you can engage it. Then target each segment with a dedicated message. This does not mean you ignore your most loyal customers, but you can get trapped if loyal customers are your only focus.
Delivery.
7. Question seven is, “What? So What? Now What? These questions are different from the first six. This question goes from gathering and analyzing information to communicating results. This question uses a simple, pragmatic framework to deliver the results of your study. Very simply, it is finding the data that matters (diagnosis), determining what the information means (insight), and creating cohort action plans based on that meaning. Answer the Essential Business Question and demote the rest of the data, methodology, and supporting materials to the appendix.